I pointed a short Node script at this site's own repository on 2026-10-23, expecting it to confirm that our design system was in decent shape. It didn't. One number came back wrong because of a bug in my counting, and another was right and unflattering. Both taught me more about measurement than the vendor write-ups I read for this piece.
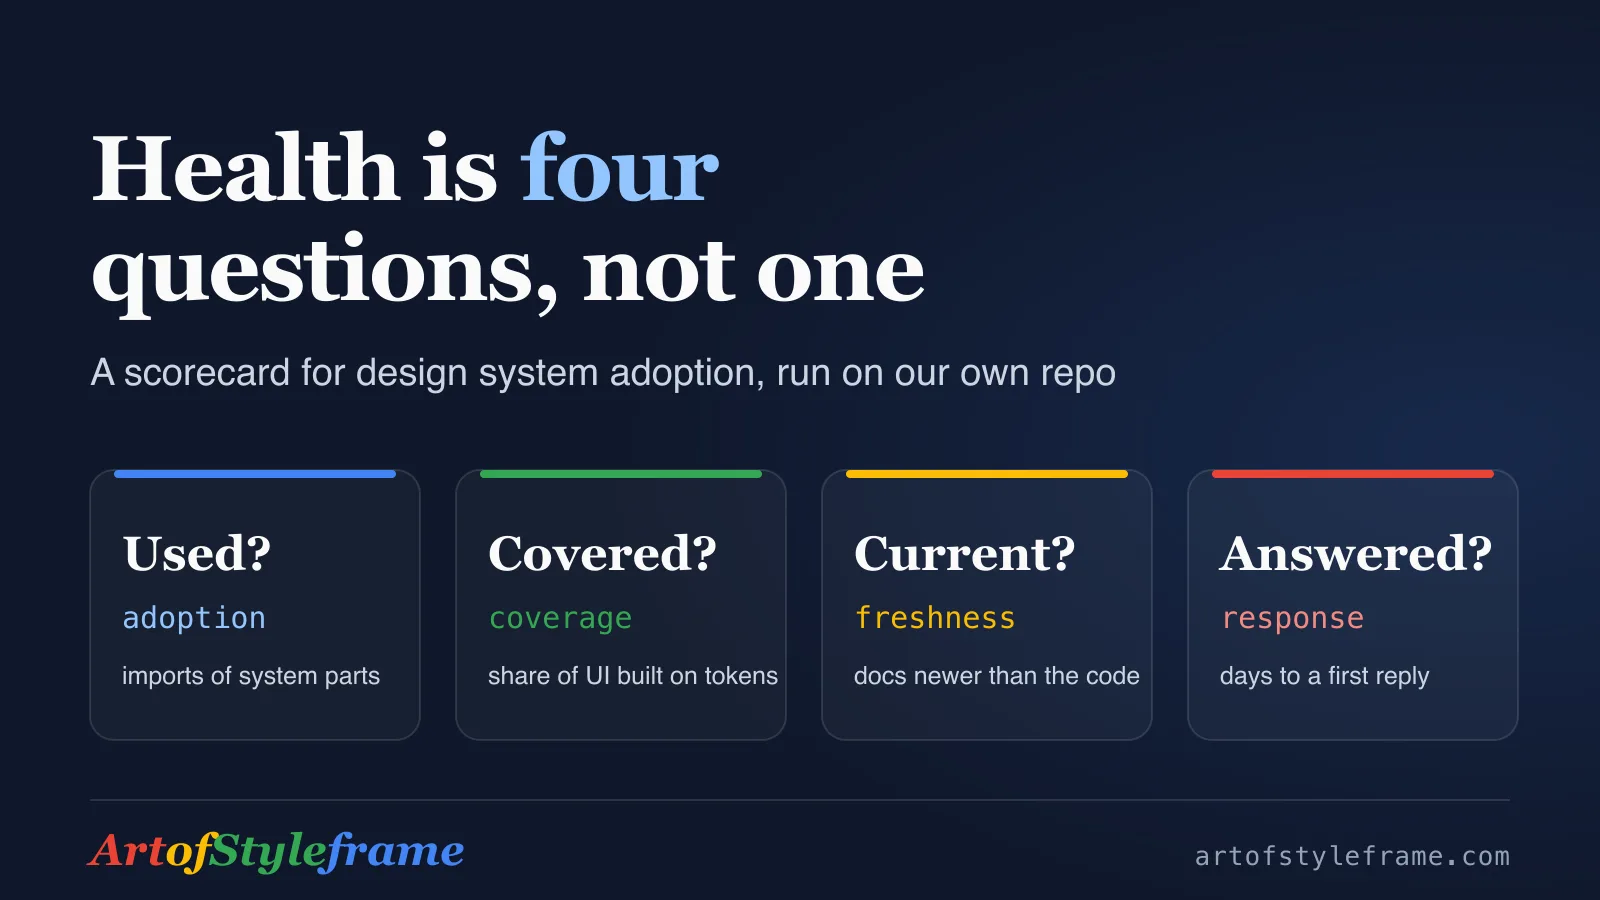
TL;DR: Design system health is four questions, not one number: is it used, how much of the interface does it cover, is it current, and does it answer requests. Each question needs its own metric, its own data source and a denominator you can defend. We ran five checks on the art-of-styleframe repo: 56.6 percent of component imports come from the shared library, 79.6 percent of tokens-versus-hex references use tokens, 2 of 13 local components have a story, and both stories predate the code they document.
Why Isn't "Adoption" One Number?
Because two different things hide behind the word. Usage is how often system parts show up. Coverage is how much of the finished interface they account for. A team can import your Button four hundred times and still build every card, table and modal by hand, and a usage chart will call that a triumph.
Add two more questions and you have a scorecard. Is the thing current: do the docs, the versions and the examples match what the code does today? And does it respond: when a team asks for a variant, how long before a person answers?
| Question | Metric | Data source | The way it lies |
|---|---|---|---|
| Used? | share of imports from the system; insertions | repo scan, Figma analytics | one heavily used component hides everything else |
| Covered? | tokens versus literals; custom CSS per route | stylesheets, bundle size | the denominator includes code that should never be tokenized |
| Current? | docs coverage; docs older than code; version lag | stories, git dates, lockfiles | a story can exist and describe a component that no longer exists |
| Answered? | days to first reply on a request | issue tracker | a fast reply with no fix reads as healthy |
Nothing here is exotic. What's rare is stating the lie next to the metric, which is the habit this article is really about.
Where Does the Data Come From?
Three places, and most teams only look in one of them.
Figma's library analytics covers the design-file side. For a published library it reports insertions, a "Top teams" list with each team's share of insertions, and a Detaches column that logs every use of the "Detach instance" setting. You can filter to 30, 60 or 90 days, or the last year, and the data goes back up to a year (Figma Help Center, 2026). Two constraints matter. It needs an Organization or Enterprise plan, and the Library Analytics API is Enterprise only. If you're on a lower plan, the design half of your scorecard stays blank, and you should say so rather than quietly leaving it out.
The code side is usually richer than people expect. react-scanner crawls a directory and writes a JSON report of which components render and which props they get, with an importedFrom option that restricts the count to your package (react-scanner). CB Insights describes a lower-tech version for teams that use plain CSS: count system class names and imports in app code, track the month-over-month growth of the CSS file, and average the lines of custom CSS per route. Their reasoning is that each of those should flatten as the system covers more ground (CB Insights). They also count deprecated components still in use and the number of unique contributors, which is a rare nod to the people side.
The third source is your own history: git dates, tracker timestamps, lockfiles. It costs nothing and nobody reads it.
One caution about the sources themselves. Most of this advice comes from vendors and consultancies. Figma's metrics article leans on Figma's own analytics, and Netguru's list is a consultancy's checklist. That doesn't make them wrong. It means the thresholds they quote are somebody's rule of thumb, not a benchmark.
What Did the Script Find on Our Own Repo?
I wrote it as one file with no dependencies, because a metric that needs an install step doesn't get run twice. It walks src/, classifies every component import as shared or local, checks which local components have a Storybook story, compares the git dates of each component and its story, and counts var(--token) references against hex literals in style blocks.
Here's the whole script. It assumes an Astro-style layout with components in src/components/, stories in src/, and a shared layer imported through one path prefix, so adapt the globs to your stack. Save it as ds-health.mjs; it needs Node 20 or newer and nothing from npm.
ds-health.mjs, about 90 lines
// ds-health.mjs: design system health numbers from one repo, no dependencies.
// node ds-health.mjs <siteRoot> --shared-prefix=@scope/ui/ [--shared-dir=path] [--skip=react]
import fs from "node:fs";
import path from "node:path";
import { execFileSync } from "node:child_process";

const flags = Object.fromEntries(
  process.argv.slice(2).filter((a) => a.startsWith("--")).map((a) => a.slice(2).split("=")),
);
const root = path.resolve(process.argv[2] ?? ".");
const skip = new Set((flags.skip ?? "").split(","));
const SHARED_PREFIX = flags["shared-prefix"] ?? "@scope/ui/";

function walk(dir, exts, out = []) {
  for (const e of fs.readdirSync(dir, { withFileTypes: true })) {
    if (e.name === "node_modules" || e.name.startsWith(".") || skip.has(e.name)) {
      continue;
    }
    const p = path.join(dir, e.name);
    if (e.isDirectory()) {
      walk(p, exts, out);
    } else if (exts.some((x) => p.endsWith(x))) {
      out.push(p);
    }
  }
  return out;
}

const src = path.join(root, "src");
const local = fs.readdirSync(path.join(src, "components"))
  .filter((f) => f.endsWith(".astro")).map((f) => f.replace(".astro", ""));
const files = walk(src, [".astro", ".ts", ".tsx"]);

// 1. Import graph: shared layer versus local components
let shared = 0;
let own = 0;
for (const file of files) {
  const text = fs.readFileSync(file, "utf8");
  for (const m of text.matchAll(/import\s+\w+\s+from\s+['"]([^'"]+)['"]/g)) {
    if (m[1].startsWith(SHARED_PREFIX)) {
      shared += 1;
    } else if (m[1].endsWith(".astro") && m[1].includes("components/")) {
      own += 1;
    }
  }
}

// 2. Forks: a local component whose name also exists in the shared layer
const sharedNames = flags["shared-dir"]
  ? fs.readdirSync(flags["shared-dir"]).map((f) => f.replace(".astro", ""))
  : [];
const forks = local.filter((n) => sharedNames.includes(n));

// 3. Docs coverage and docs freshness (a story older than its component)
const stories = walk(src, [".stories.tsx", ".stories.ts"]);
const storyFor = (n) => stories.find((f) => path.basename(f).startsWith(n + "."));
const documented = local.filter(storyFor);
const lastCommit = (f) =>
  execFileSync("git", ["log", "-1", "--format=%cs", "--", f], { cwd: root, encoding: "utf8" }).trim();
const stale = documented.filter(
  (n) => lastCommit(path.join(src, "components", n + ".astro")) > lastCommit(storyFor(n)),
);

// 4. Tokens: var(--x) references against hex literals, style blocks only
let vars = 0;
let hex = 0;
for (const file of walk(src, [".astro", ".css"])) {
  const text = fs.readFileSync(file, "utf8");
  const blocks = file.endsWith(".css")
    ? [text]
    : [...text.matchAll(/<style[^>]*>([\s\S]*?)<\/style>/g)].map((m) => m[1]);
  for (const b of blocks) {
    vars += (b.match(/var\(--/g) ?? []).length;
    hex += (b.match(/#[0-9a-fA-F]{3,8}\b/g) ?? []).length;
  }
}

const pct = (a, b) => (b ? ((a / b) * 100).toFixed(1) + "%" : "n/a");
console.log(JSON.stringify({
  sharedImports: shared, localImports: own, sharedShare: pct(shared, shared + own),
  forks, localComponents: local.length, documented: documented.length,
  docsCoverage: pct(documented.length, local.length), staleDocs: stale,
  varRefs: vars, hexLiterals: hex, tokenShare: pct(vars, vars + hex),
}, null, 2));
The command I ran, with our own paths swapped for placeholders:
node ds-health.mjs ./site --shared-prefix=@your-scope/ui/ --shared-dir=./shared/components --skip=reactRun against commit 04c3525f0f of our repository, with the React copies of the components skipped, it reported this:
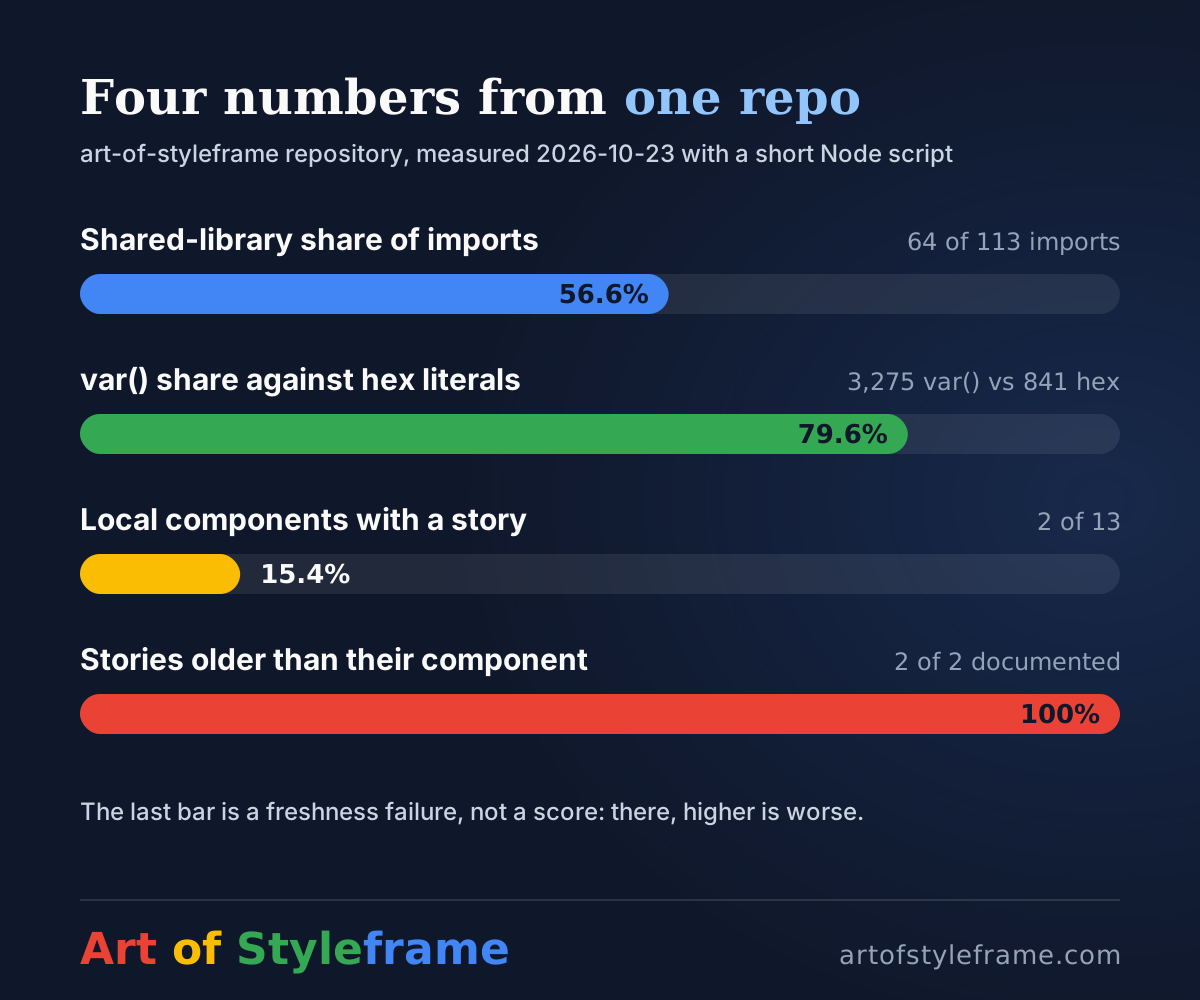
| Check | Result |
|---|---|
| Imports from the shared library | 64 of 113, so 56.6% |
| Local components | 13, none unused |
| Local components with a story | 2 of 13, so 15.4% |
| Stories older than their component | 2 of 2 |
| var() references against hex literals | 3,275 against 841, so 79.6% |
I'll be straight about two things. First, 56.6 percent doesn't mean the shared library is "56.6 percent adopted". It's a share of import statements in one site that consumes it, and two of them, the base layout and the breadcrumb schema, account for 54 of the 64. Second, the one on documentation is the number I'd have preferred not to see. Eleven of our thirteen local components, every one of them an interactive tool, have no story at all.
Why Was My First Number Wrong?
The first run said 4,842 token references and 1,239 hex literals. Those totals looked healthy until I noticed the same file name twice in my own breakdown: ColorPaletteGenerator.astro and ColorPaletteGenerator.tsx, both with 211 references and 74 literals, to the digit.
The repo keeps static React copies of its components for Storybook and for a design-tool sync, under src/components/react/. My scan was reading every one of them as a second, separate piece of UI. Skip that folder and the absolute counts drop by about a third, to 3,275 and 841.
The ratio barely moved, from 79.6 to 79.6 percent. That's the useful part. Duplication inflates counts and leaves ratios alone, which is a decent argument for reporting shares rather than totals when you can't be sure what your scanner is reading. It's also an argument for opening the breakdown before you trust the headline. I only caught this because I looked at the biggest files, not because anything warned me.
What Does the Denominator Hide?
Even the corrected 79.6 percent is a blended figure, and blends are where metrics start to mislead.
Split the same count in two. The eleven interactive tools and their pages (a colour palette generator, a contrast checker, a type scale calculator and the rest) hold 501 of the 841 hex literals. Outside them, 1,877 token references sit against 340 hex literals, so 84.7 percent. Inside the tools it's 73.6 percent.
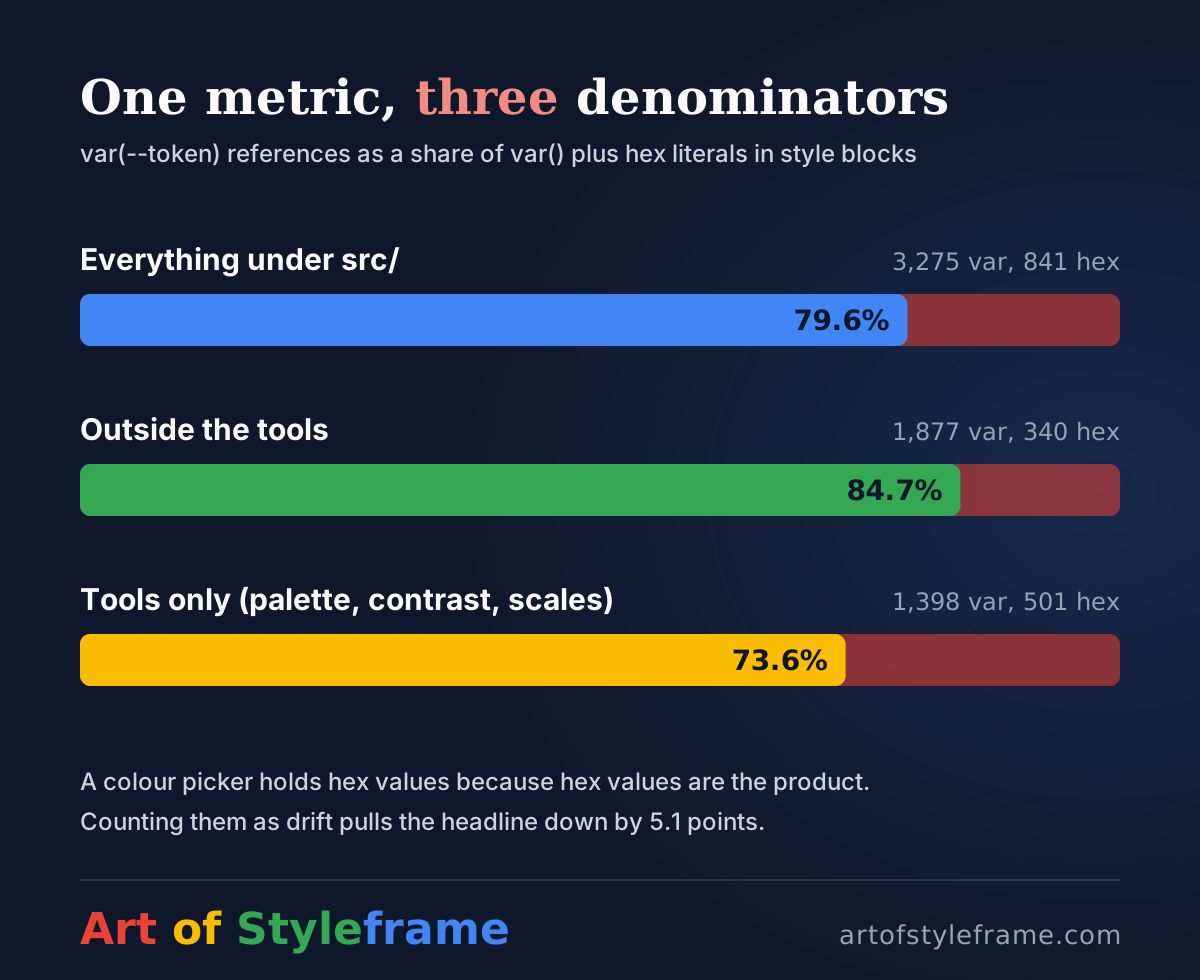
Is the 73.6 a defect? Mostly not. A palette generator contains hex values the way a calculator contains digits: they're what it computes and displays. Counting them as drift drags the headline down by 5.1 points and sends someone off to "fix" code that's working. Counting them as clean hides real drift in the tools, which are some of the most visited pages we have.
Neither answer is neutral. So the rule I'd follow is: publish the denominator next to every percentage, and say what you excluded and why.
Publish the denominator beside every percentage, or you're circulating a rumor with a decimal point.
If you want the stricter version of this check, with severity weights and a list of file and line pairs, the Claude Code plugin in our token audit walkthrough does it. The scorecard here is deliberately the cheap version, the one you can run before you've decided whether to install anything.
Is a Detach a Failure or a Message?
It's a message, and I'd argue most teams read it as an accusation.
The athenahealth designer quoted in Figma's metrics article says she wants to know why a component was detached, because the cause might be a bug, a missing option or a combination nobody planned for. She caught an auto-layout bug from an uptick in detaches before anyone reported it (Figma Blog, 2026). The same piece warns that a high detach rate isn't always bad.
Code has its own detach, and it's called a fork. Our repo has one. The shared package ships a BlogCard of 286 lines. This site's pages import their own 236-line BlogCard instead, in five places, and never touch the shared one. The notes kept beside our Storybook say the shared card was never what this site rendered. I can't date the split, because the git history for both files was squashed on 2026-10-04, so I won't pretend to know whether it was a deliberate call or a convenient one.
What I can say is what the metric should do with it. It shouldn't turn red and trigger a review. It should open a question: is the shared card missing something we needed, or is ours a stylistic preference that costs us a second thing to maintain? Those have opposite fixes. A health score that can't tell them apart will push teams to hide forks, and a hidden fork is worse than a visible one.
This is also where the human side of adoption takes over. zeroheight's survey of 147 design system practitioners found only 32 percent satisfied with how well their organizations secured buy-in, down from 42 percent the year before (zeroheight, 2026). No script produces buy-in. The most a metric can do is show where it's missing.
Are Your Docs Current, or Just Present?
Present is easy to measure. Current is harder, and it's the version that matters.
Our two stories, AdUnit and BlogCard, were last touched on 2026-10-04. The components they describe changed on 2026-10-16 and 2026-10-19, and the React copies the stories actually render were both last touched on 2026-10-16. That's 12 and 15 days of drift on the only two documented components, and the stories are exactly as green as they were before, because nothing compares them to the code.
That's the gap in "documentation coverage". A coverage percentage tells you a story file exists. It says nothing about whether the story still tells the truth. The check that does is a date comparison, five lines of git, and it fits in the same CI job that already counts files. Our Storybook setup guide covers enforcing coverage in CI, and a freshness check is the natural second gate once coverage holds.
The same logic applies to versions. Don't count releases, count lag: how many consuming apps still sit on the previous major at the end of each quarter, as we argued in the versioning and changelog guide. A lag that doesn't shrink inside the deprecation window means the window is too short or the codemod doesn't exist.
What Thresholds Should You Start With?
Here's the part where I'm guessing, so I'll label it. These are my starting points for a system with a handful of consuming teams. They're not an industry standard, and I'd rewrite them after two quarters of your own data.
| Metric | Green | Amber | Red |
|---|---|---|---|
| Token share (outside deliberate exceptions) | 85% and up | 70-84% | under 70% |
| Components with a current story | 80% and up | 50-79% | under 50% |
| Stories older than their component | none | 1 or 2 | more than 2, or any older than a quarter |
| Median days to first reply on a request | 2 or fewer | 3-7 | more than 7 |
By that table we'd be amber on tokens (84.7 outside the tools, just under the line), red on current stories, and unmeasured on response time, since this repo has no request tracker to read. I haven't gamed the thresholds to flatter us, which is why two of them look bad.
An external threshold worth knowing: Netguru suggests flagging a component for deprecation when it has under 5 percent adoption after six months, and quotes an example audit of 32 components, 58 tokens and 4 libraries, three of them under that mark (Netguru). It's a heuristic from one consultancy. Useful for starting an argument, not for ending one.
Which Metrics Backfire?
Any metric that someone's review depends on.
Make token share a target and you get tokens defined as the literal they replace: --blue-1b4fd8: #1b4fd8, one reference, a perfect score and no meaning. Make insertions a target and designers will drop components they'll later detach. Figma's own guidance says to set the goal first, because metrics are a means to an end, and it admits that people won't report every issue, so numbers fill gaps and don't replace conversations.
I'd go further than that. A scorecard should never be used to compare teams. It exists to compare a system with itself last quarter. The moment a chart ranks product teams by their coverage, you've turned a diagnostic into a leaderboard, and you'll spend the next quarter arguing about definitions instead of fixing the gaps.
And a few things the numbers can't see at all. Whether the system is the reason a launch shipped faster. Whether a quiet team has adopted it or ignored it. Whether the 15 percent of components with stories are the 15 percent people actually read. Those need a person asking, and the scorecard's job is to tell you whom to ask.
A Quarterly Routine That Survives Contact With a Roadmap
Keep it small enough that skipping it feels silly.
- Run the same script on the same day each quarter and commit the JSON output next to the code, so the history lives in git.
- Write the denominators and exclusions into the output, not into a wiki page nobody reads.
- Open one ticket per red or amber metric, each phrased as a question ("why do six tools have no story?") and not a verdict.
- Check the figure for the response question by hand the first time: export the requests with their creation and first-reply timestamps, take the median, and note what you couldn't count.
If a metric turns out to be unhelpful, drop it in writing. A scorecard that only grows becomes a chore, and chores get skipped.
I'd run exactly this on a new system before I'd buy any analytics tool. Free numbers from your own repo will show you which questions you actually have, and then you'll know what a paid dashboard has to answer.